Reports in any organization are prime to provide valuable information about various things that happen. Be it w.r.t hiring, cash outflow, cash inflow, etc. If we do not take a look at the data timely and do not provide importance to it, our emotions might take us in a random direction. Power BI has a beautiful way of providing insight about the data visually. Its features like drill down help us play with the report unlike the traditional SSRS reports which are usually static.
We @CloudFronts use below 5 reports primarily amongst many other Power BI reports that help us taking precise decision all the time and gives direction wile being in the management meeting as well.
Let’s take a look at how an where each report help us in the decision making.
- Allocation Report: This report provides us with the utmost important information from the organization, that is the allocation of resources on the project. It provides a very vital information as to which resource is booked on which project, how many hours and on which days.
Depending on the hours of allocation the color coding is decided. Let’s assume if the working hours of the resource is defined as 8 hours in the Work Hour Template (a feature in PSA) and he/she is allocated for more than 80% it is GREEN. If it is below 80% and above 30% is YELLOW else RED.
GREEN indicates that the health of the company is good and needs hiring. Subsequently, HR Dept. can be intimated for hiring requisition in the required department.
The report has 4 sub reports to it as you can see it in the screenshot below:
- Billable Allocation
- Billable & Non-Billable Allocation Report
- Billable & Proposed Allocation
- Billable & Non-Billable Client Work
Each of them, by their names are self-explanatory.
Below is the screenshot of the report and the Drilled Down report of Allocation Report.
The Report shows the following information:
- to which the resource belong.
- The Resource
- Weekly Allocation of the entire year (52 weeks)
Allocation Report:

Drill Down of the same:

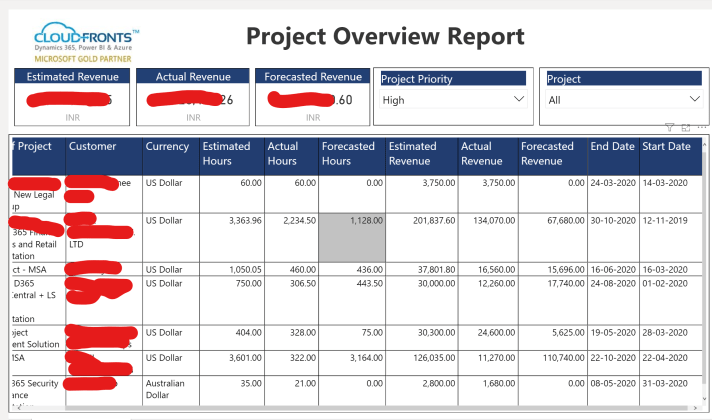
- Project Overview Report: This report gives the over all heath information of all the Active projects running in the company. For a better visibility and bifurcation, we prefer mentioning the priority of the project to be of High, Medium and Low priority.
We created views in PSA based on these priorities and hence created Power BI Report filters based on it as well.
The report gives the overview for the following crucial information like:
- Estimated Hours: These are the hours that are derived after the project WBS is ready and are the sum of all the Main tasks.
- Actual Hours: These are the sum of all the hours that are approved by Project Manager on the time entries done by the team members.
- Forecasted Hours: These are the hours that are the allocations done by the Resource Manager against the project for future. So the sum of all the future allocations are shown up here.
- Estimated Revenue: This is calculated on the basis of Estimated hours multiplied by the per hour rate from the pricelist of the project. So it gives the over all estimate revenue for the project.
- Forecasted Revenue: This is the current forecast of the expected revenue and is calculated on the basis of the no of hours allocated multiplied by the per hour rate from the pricelist of the project.
During the weekly meetings with the management, they answer important question as to why is the forecast looking week, in case it is? How much of the estimated hours are balance on the project and in case we need more looking at the current state of the project? When is the project ending? Start Date gives us an understanding of since how long is the project running.
Project Overview report screenshot:
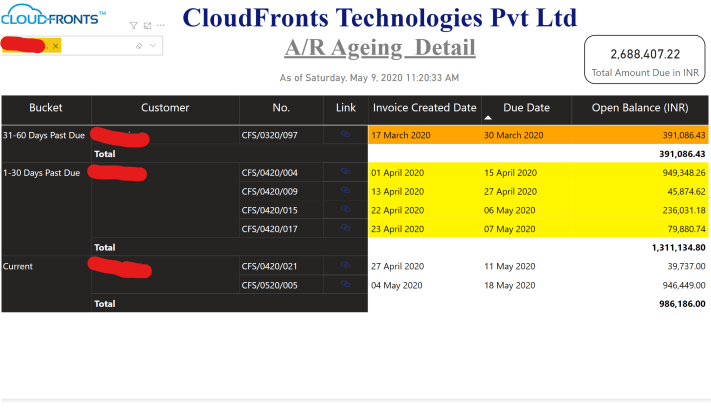
- AR Report: This report by the name itself gives the information about the Accounts Receivable information against the invoice raised in PSA for the customers.
The report helps in maintaining the cashflow of the organization and helps in keeping the tab of which customers invoice is overdue since when and needs a follow up.
The report is bifurcated into buckets:
- 90 Days and above overdue
- 31 to 60 Days overdue
- 1-30 Days overdue
- Current invoices.
They by there name of the buckets helps you understand, what information might be available in each one of them.
There is a link also provided in the report to navigate it directly to the invoice created in PSA to review any additional information in case needed.
Screenshot of the AR Report:
 4. Support Metrics Report
This is one of the beautiful reports that gives an overall view of how many no of cases are open in our support module against each customer, including internal tickets.
The bar chart on the report when clicked opens up all the support tickets for that customer, which has the link to open the report in the D365 CRM.
It also provides lots of vital information about the cases like:
- Case Created on
- Case Name
- Case No
- Follow up date
- Owner
- Customer
This report answers the important questions like, when was the case created and when is the next follow up on the case? Is it been too long that the case is opened by the customer?
Support Metrics Screenshot

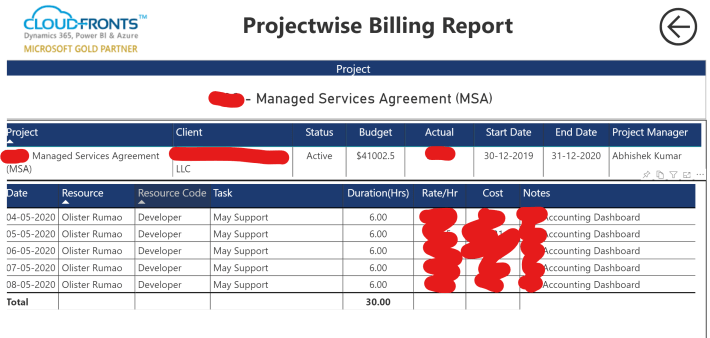
- Billing Report: This is an important report for project Manager and Accounting department both in terms of billing standpoint.
Project Manager get the information as to, whether the billing report shows the exact figure as the allocation report shows. If yes, then it is good else he/she can get it corrected by the respective project team member of the project, before approving the time entries.
Accounting team on the contrary can drill down these reports and extract the hour wise billing report that the client demands and send it with the invoice in case needed.
The report can be filtered by, Week, Month, Year.
Screenshot of the Billing report

Drilled report on Project wise billing report
Conclusion:
The above reports help any organization to take the decision for the betterment of the organization. It not only helps in decision making but, also helps in the routine operational activities of the company.
The report mentioned above are a few examples and are the 5 best ones out of many other useful reports created.

One thought on “5 Best Power BI Reports that helps organization take decisions with Dynamics 365 CRM”